

Air Quality Monitoring
CO₂, PM2.5, VOCs and humidity at a glance.
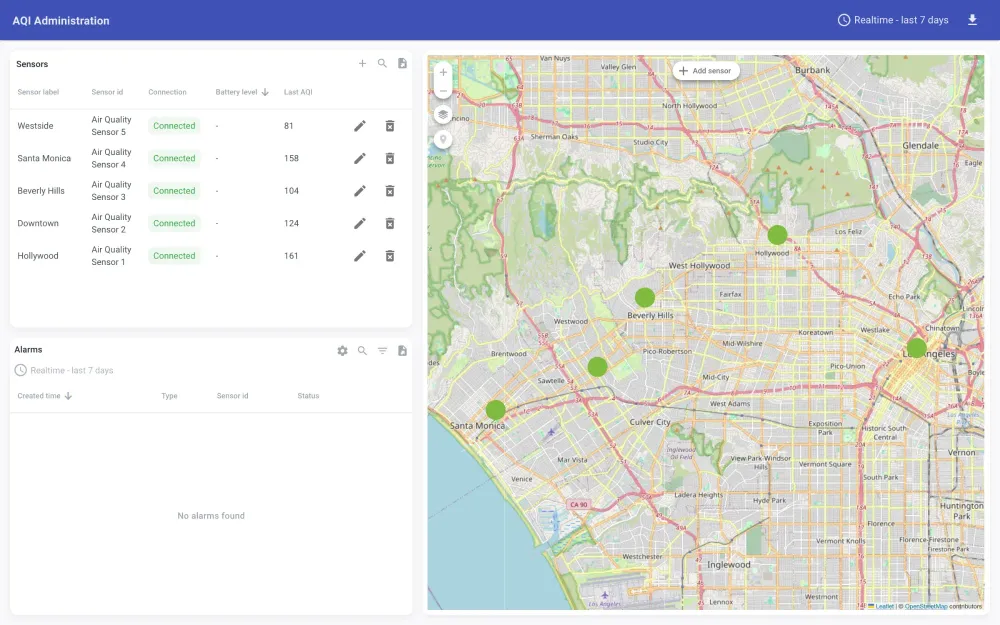
Embedded from preview.edgekinect.com. Anonymous, read-only public view. Some widgets may show “no data” while their source devices are idle.
Best on a larger screen — open in a new tabWhat’s in this view
CO₂, PM2.5, VOCs and humidity at a glance.
Indoor environmental monitoring dashboard: CO₂, particulate matter (PM2.5/PM10), volatile organic compounds, temperature and humidity tracked across spaces for occupant wellness, HVAC tuning and IEQ reporting.
01
CO₂ levels
02
PM2.5 & PM10
03
VOC trends
04
Temperature & humidity
FAQ
Questions about this dashboard
What the Air Quality Monitoring demo shows, and how it maps to a real deployment.
CO₂ as a proxy for ventilation effectiveness, PM2.5/PM10 particulate matter, total volatile organic compounds (tVOC), plus ambient temperature and humidity.
Keep exploring
More live dashboards.
Every demo is a working EdgeKinect Vision deployment with public, read-only access.
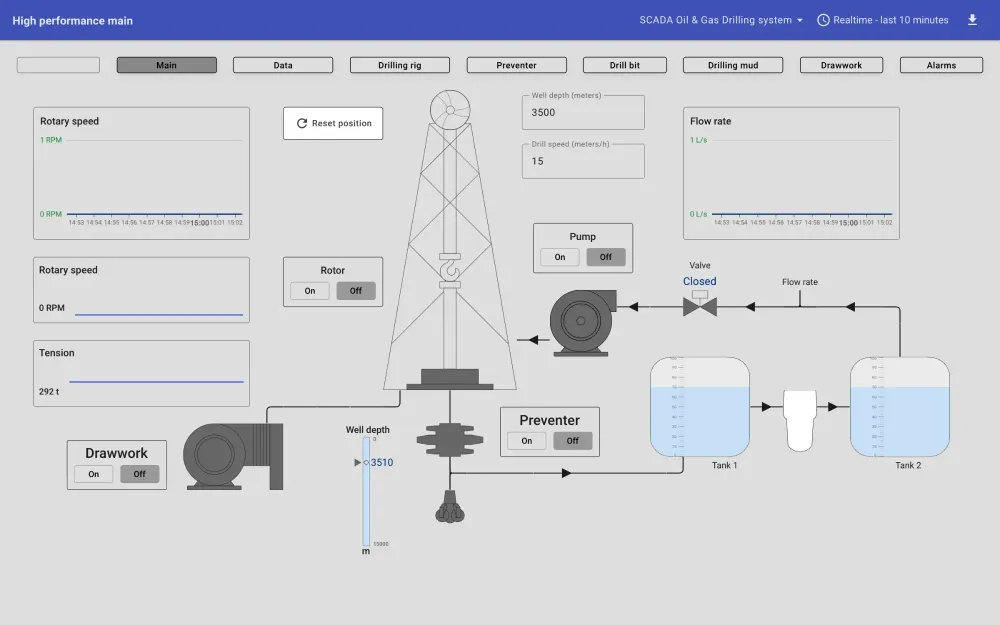
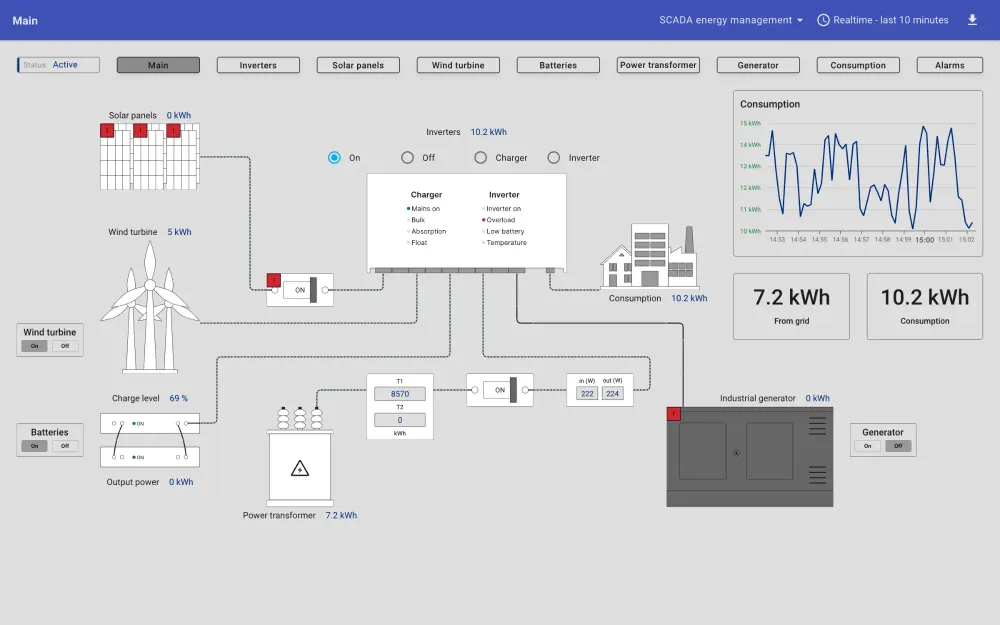
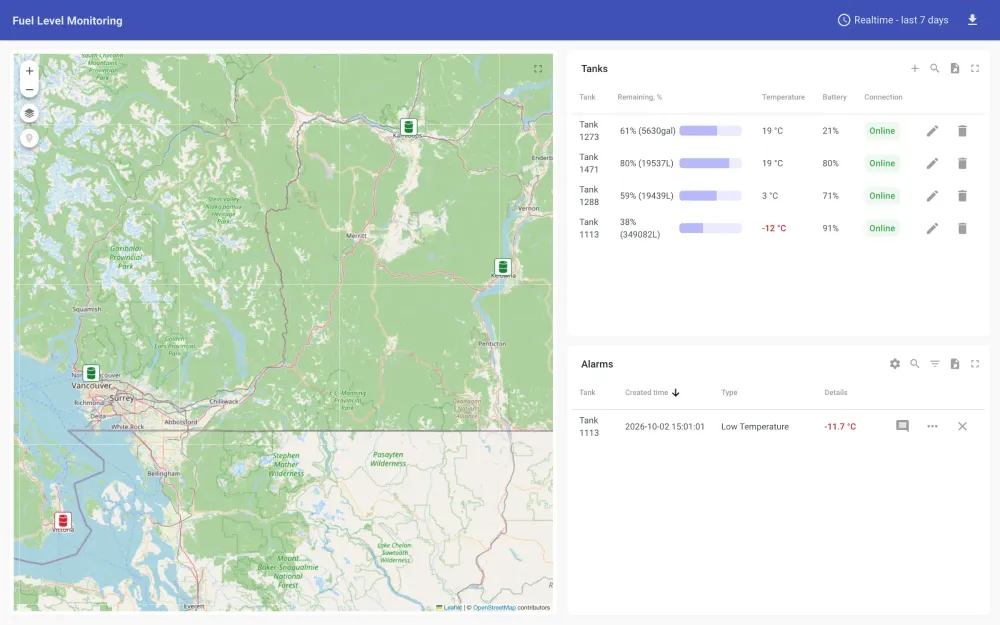
Talk to us
Want this dashboard on your own sensors?
Tell us what you monitor and where. We’ll scope the sensors, the connectivity and the dashboard with you.
- Sales
- (778) 900-5895
- [email protected]
- Hours
- Mon–Fri, 08:30 AM – 04:30 PM PST