
Fuel & Water Monitoring
Tank levels, flow rates and consumption trends.
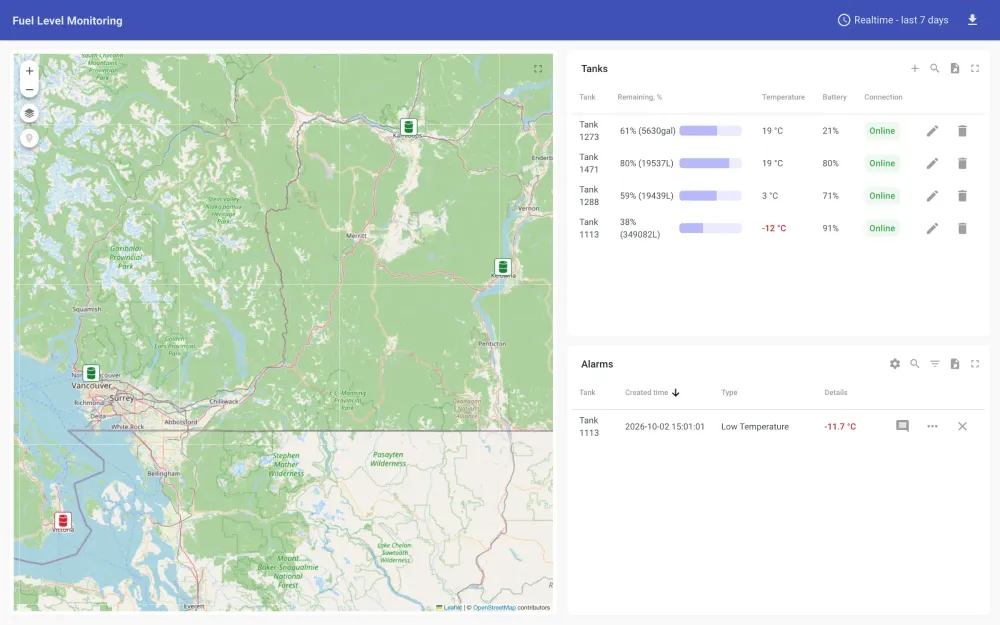
Embedded from preview.edgekinect.com. Anonymous, read-only public view. Some widgets may show “no data” while their source devices are idle.
Best on a larger screen — open in a new tabWhat’s in this view
Tank levels, flow rates and consumption trends.
Remote tank monitoring for fuel depots and water infrastructure. Capacity, fill rate, consumption and exception thresholds at a glance.
01
Level gauges
02
Flow trends
03
Threshold alerts
04
7-day history
FAQ
Questions about this dashboard
What the Fuel & Water Monitoring demo shows, and how it maps to a real deployment.
Ultrasonic and pressure-based level sensors for tanks, plus flow meters for in/out rate. Devices commonly connect via LoRaWAN or NB-IoT and are normalised by EdgeKinect Vision.
Keep exploring
More live dashboards.
Every demo is a working EdgeKinect Vision deployment with public, read-only access.
Talk to us
Want this dashboard on your own sensors?
Tell us what you monitor and where. We’ll scope the sensors, the connectivity and the dashboard with you.
- Sales
- (778) 900-5895
- [email protected]
- Hours
- Mon–Fri, 08:30 AM – 04:30 PM PST